SAP Digital Boardroom helps Parkland Health manage pandemic
Parkland Health managed a surge of cases caused by the COVID-19 pandemic by using data analytics based on SAP Analytics Cloud and SAP Digital Boardroom.
Data analytics based on SAP Analytics Cloud and SAP Digital Boardroom played a significant role in helping a major hospital system prepare for and manage a surge of activity brought on by the COVID-19 pandemic.
Parkland Health and Hospital System in Dallas has a progressive strategy for analytics, given its status as both a safety net hospital for Dallas county and a designated Federal Emergency Management Agency (FEMA) regional site. But the surge of COVID-19 cases enabled the hospital to put some underused analytics investments to good use.
The technology approach to managing COVID-19 cases centered around SAP Analytics Cloud and the SAP Digital Boardroom. SAP Analytics Cloud is a business intelligence (BI) platform on SAP HANA that enables companies to manage and make use of data flowing in from a variety of sources. SAP Digital Boardroom is a data visualization application that presents data from SAP Analytics Cloud in customizable dashboards.
Scott Harrison
Parkland Health built an executive command center using SAP Analytics Cloud and SAP Digital Boardroom to provide the health system's staff with critical information, said Scott Harrison, Parkland Health's chief data officer.
In the past year, Parkland's data science team had been using SAP Analytics Cloud and SAP Digital Boardroom to deliver useful analytics to clinical staff, operations and business groups, but adoption was low, Harrison said.
And then COVID-19 hit and everything changed.
COVID-19 changes everything
"[We wanted] the ability to promote a product within the hospital without really shoving it down their throats," Harrison said. "We started getting more visibility and then -- lo and behold -- February hits, we start hearing the rumblings of COVID, and then in March all of the sudden we [need to] have a command center."
The push to quickly build a command center was a proactive measure based on Parkland Health's designation as a safety net hospital, which means it legally has to provide care for patients regardless of their ability to pay. And its status as a FEMA regional site required the health system to monitor and report data such as admitted patients and available bed space to the agency, as well as to hospital management and its board of directors.
Beginning March 13, the data science team began to create the SAP Digital Boardroom dashboards that could feed data to the command center during the pandemic, and the initial drafts were available within a couple days, according to Harrison.
"We really didn't know what our volumes were going to be like, but [we saw] what was happening in Seattle and on the East Coast, and [asked what would this] look like for us," he said. "We really had to focus on what we needed to track to manage our hospital operations, and we focused our initial efforts on our [Patient Under Investigation/Patient Under Monitoring] numbers -- how many are we having to put in the hospital, how many are we resolving."
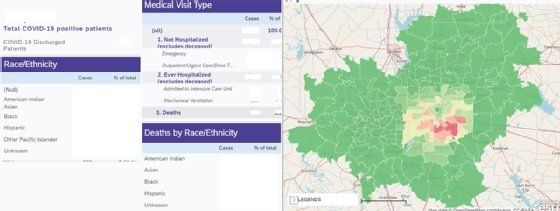
Parkland Health and Hospital System in Dallas uses SAP Digital Boardroom dashboards to monitor COVID-19.
Dashboards to the rescue
The data science team put together a Dashboard that took data coming in near real time from the hospital's Epic electronic medical record (EMR) system. Data was staged in Epic Caboodle, a data warehouse designed for healthcare organizations, moved into SAP HANA, and propagated to the SAP Digital Boardroom dashboard.
"It was pretty powerful, and we were able to show all of our testing metrics," Harrison said. "The good thing is that Parkland built a new hospital in 2015 and it has a lot of modern capabilities within its lab system that allows us to turn around lab results much quicker than some of the other agencies were able to, so our testing volumes were heavy."
This provided a critical look at the COVID-19 cases Parkland had to handle from one moment to the next, but the data science team also had to consider how to make data a driving force throughout the pandemic and beyond. While it was valuable to know what was happening in the moment, the data science team knew it was critical to reliably predict what might come next.
The uncertainty about the pandemic was causing angst in Parkland Health's board of directors and C-suite, Harrison explained, so the data science team was tasked with building a predictive model for capacity planning in SAP Digital Boardroom that performed better than the COVID-19 Hospital Impact Model for Epidemics, a predictive model developed by Penn Medicine that was widely used early in the epidemic.
"The data science team came up with our own model based on mortality rates, hospitalization rates and infectivity rates that's tracking even today of being within just a few patients shy of being spot on for ICU and overall census numbers," Harrison said. "That really helped out, but it also gave us the visibility and adoption that we wanted to push forward with more AI and machine learning capabilities."
Qualtrics provides capacity data
Qualtrics, a relative newcomer to the SAP product lineup, also came in handy for managing resources during the pandemic, according to Harrison. The customer experience platform, which is typically used to create surveys that measure customer and employee sentiment, was employed to track inventory and usage of critical equipment, such as respirators.
When COVID-19 cases began to rise, Parkland nurses, respiratory therapists and pharmacists used paper and clipboards to track things like the number of available beds or respirator inventory levels, Harrison said. With 7,000 employees and 800 in-patient beds, the paper-based process quickly became unworkable. The hospital was also stockpiling respirators and needed a way to track how many were on hand, how many were in use and how many were clean and ready to use.
We've shown exponential growth in the technical capabilities between March and now.
Scott HarrisonChief data officer, Parkland Health and Hospital System
"We needed a way to get all of these numbers propagated so that we knew at any moment in time what we have on hand and what we're using," he said. "We had Qualtrics licenses; let's create some forms for our staff to track staffing numbers, ventilator numbers, ventilator supply numbers, critical inventory for pharmacy."
Using simple Qualtrics survey forms, staff members filled in the information, which was then propagated to the command center dashboard. This was integrated with the Epic EMR data to provide accurate capacity numbers, according to Harrison.
"It would have our capacity numbers -- this many beds in use, this many beds available, here's how we're doing," he said. "It had all of our virtual testing sites, and these mobile sites that we set up drive-thru testing, and it even had staffing numbers and showed the green, yellow, red staffing numbers for each unit."
Data preparation critical
Ultimately, SAP Analytics Cloud and SAP Digital Boardroom have proved to be valuable BI and data management tools, Harrison explained. But they are only tools, and other BI platforms offer similar capabilities. Success comes from what you do behind the scenes with preparing the data to be ingested into the tools, he said.
"We've tried to get people to understand that it's all in the process and what you're doing to the data to make it usable," Harrison said. "Don't make a technical solution just something in IT, make it something that operations co-creates with IT. That's been a heavy focus for us, and it only accelerated when COVID hit."
The approach has moved analytics from a peripheral position in the Parkland Health IT landscape to a leading role in driving its daily operations. For example, a CFO dashboard that before was used only sparingly before COVID-19 is now getting hundreds of hits each month, Harrison said. The command center dashboards are still getting thousands of hits each day, even as COVID-19 cases have declined.
"We've shown exponential growth in the technical capabilities between March and now," he said. "We were already down the path of showing that we have a mature analytics program, then COVID hit and that gave us the political capital that we needed [to get buy-in from] our CEO or CFO. It's literally driving our daily operations of the hospital."


 Scott Harrison